
An integrated dashboard on Business Central that removes manual reporting across the whole group.
Grupo Mayo (Ediciones Mayo and LEN) is a scientific health communication publisher with offices in Barcelona, Madrid and the Basque Country. It runs editorial projects, training, events and media for the pharmaceutical industry. Its management needed a complete view of the business, from sales performance to the profitability of each project, without waiting for the monthly close or relying on hand-built reports.
- Client
- Grupo Mayo
- Industry
- Scientific health communication publisher
- Services
- Data and dashboards
- Technologies
- Power BI, Power Query, Business Central, SharePoint, Power Automate
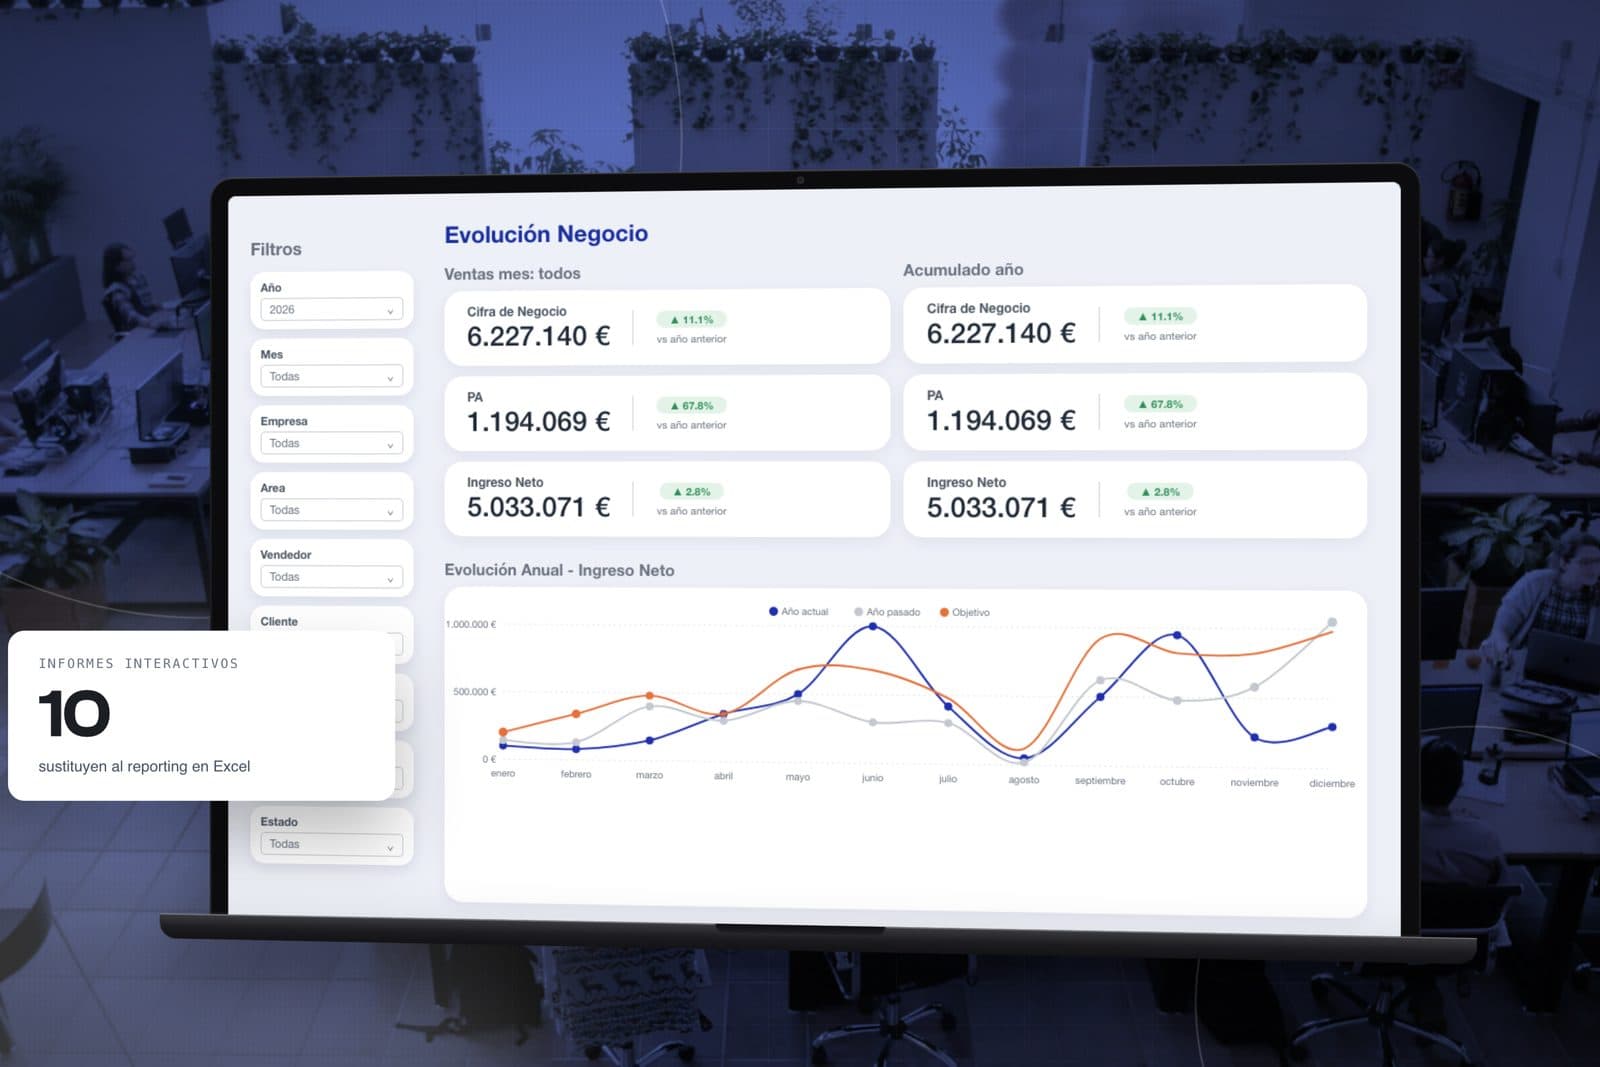

The challenge
Business tracking relied on Excel sheets, reports each team built to its own criteria and direct queries to Business Central. Every figure existed in several versions and none of them fully matched. Preparing the monthly report consumed hours from the sales and finance teams, and the information reached management late.
The challenge went beyond connecting the ERP. The group's financial logic (targets per salesperson, break-even points, year-on-year comparisons) had to be translated into a model that refreshed on its own and in which each profile accessed only the information that belonged to it.
The reports that come with Business Central only see Business Central, and here the figures that mattered came from crossing several sources. The decision was not which reporting tool to use, but whether to build a common model underneath that could hold all of them. We built it, and we left it so the team can keep adding measures without us.
Our approach
The work began with the sources. We connected Power BI to the Business Central web services of Ediciones Mayo and LEN and unified projects, planning lines, ledger entries, resources, salespeople and targets in a single model. The tables that lived outside the ERP (customer sheets, targets per salesperson, break-even points) were brought in from SharePoint. No team now maintains two versions of the same information.
The most demanding part was converting the way Grupo Mayo measures its business into calculations that behave the same in every view. We developed more than 200 DAX measures: dynamic comparisons with the previous year, pre-sales success rates, average tickets, distributions per business line and contextual measures that adapt to the active filters.
The result is ten interactive reports spanning sales performance to profitability per project, designed to be read in a minute: what works, what is drifting and where. Each report answers a concrete question from a team, not a generic list of indicators.
A Power Automate flow refreshes the data with a single click from inside the report, with concurrency control to prevent conflicting updates. Row-level security ensures each salesperson sees only their team, and audience distribution in the Power BI app determines which reports each profile sees.
- 01.
Direct integration of Power BI with Business Central and SharePoint
- 02.
Translation of the group's financial logic into more than 200 measures
- 03.
Design of ten reports for management, sales and finance
- 04.
Automated refresh and role-based security
Architecture
The building blocks of the system and how data flows between them.
01Sources
- Business CentralWeb servicesPower Query + DAXOData, daily
- SharePointComplementary tablesPower Query + DAXPower Query
02Transformation and modeling
- Power Query + DAXModellingPower BIDataset
03Delivery and governance
- Power AutomateRefresh in 1 clickPower BIOn-demand
- Power BI10 interactive reportsPower BI AppRLS, Audiences
- Power BI AppAccess, Audiences
The impact
The sales and finance teams no longer build reports by hand. The weekly hours spent cross-checking spreadsheets now go to selling and analysis.
Sales performance, profitability per project and the year-on-year comparison live in one place, up to date and accessible from any device.
Role and audience permissions mean a salesperson sees their portfolio, a manager their office and management the whole group, with no copies or parallel versions.
The model takes on new sources and new questions without redoing the work. Grupo Mayo refreshes and queries the information without depending on technical profiles.
The work did not end with the ten reports. We are still with the team defining the next dashboards as new questions come up.
- 01.
Manual reporting eliminated
- 02.
A consolidated view of the group with same-day data
- 03.
Access tailored to each profile
- 04.
An analytical base ready to grow
- 05.
After delivery
Project results
Interactive reports that replace the Excel reporting
10
Business measures translated into calculations that refresh on their own
+200
To refresh Business Central data from inside the report
1 click
What the client says
Chini Torres
CFO en Grupo Mayo
“Trabajar con Laketab nos ha permitido dar un salto claro en cómo gestionamos la información. Hemos pasado de procesos manuales a un reporting automatizado, fiable y completamente alineado con nuestra realidad de negocio. No sólo han desarrollado la solución, sino que ha entendido la lógica financiera y operativa detrás, adaptando el modelo a nuestras necesidades reales. Estoy segura de que seguiremos trabajando juntos en el futuro.”
Related case studies
View all case studies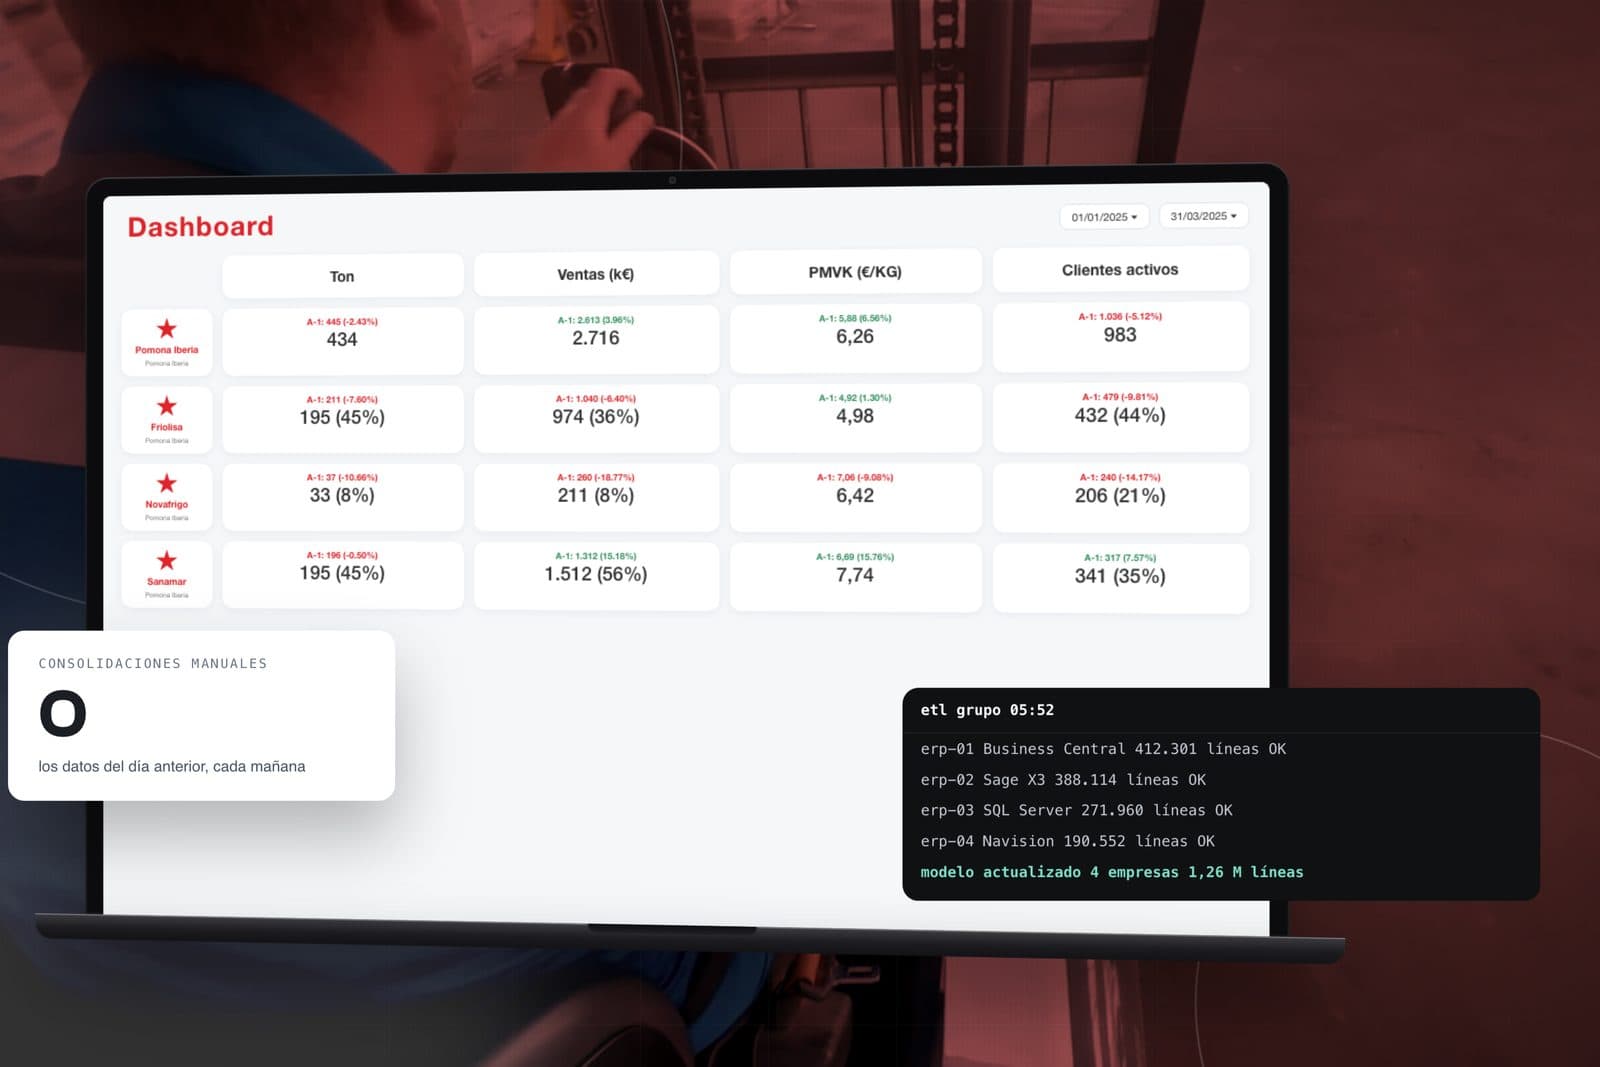
Grupo Pomona Iberia
A Business Intelligence platform that consolidates the sales and purchases of four companies into a single model, refreshed every day.
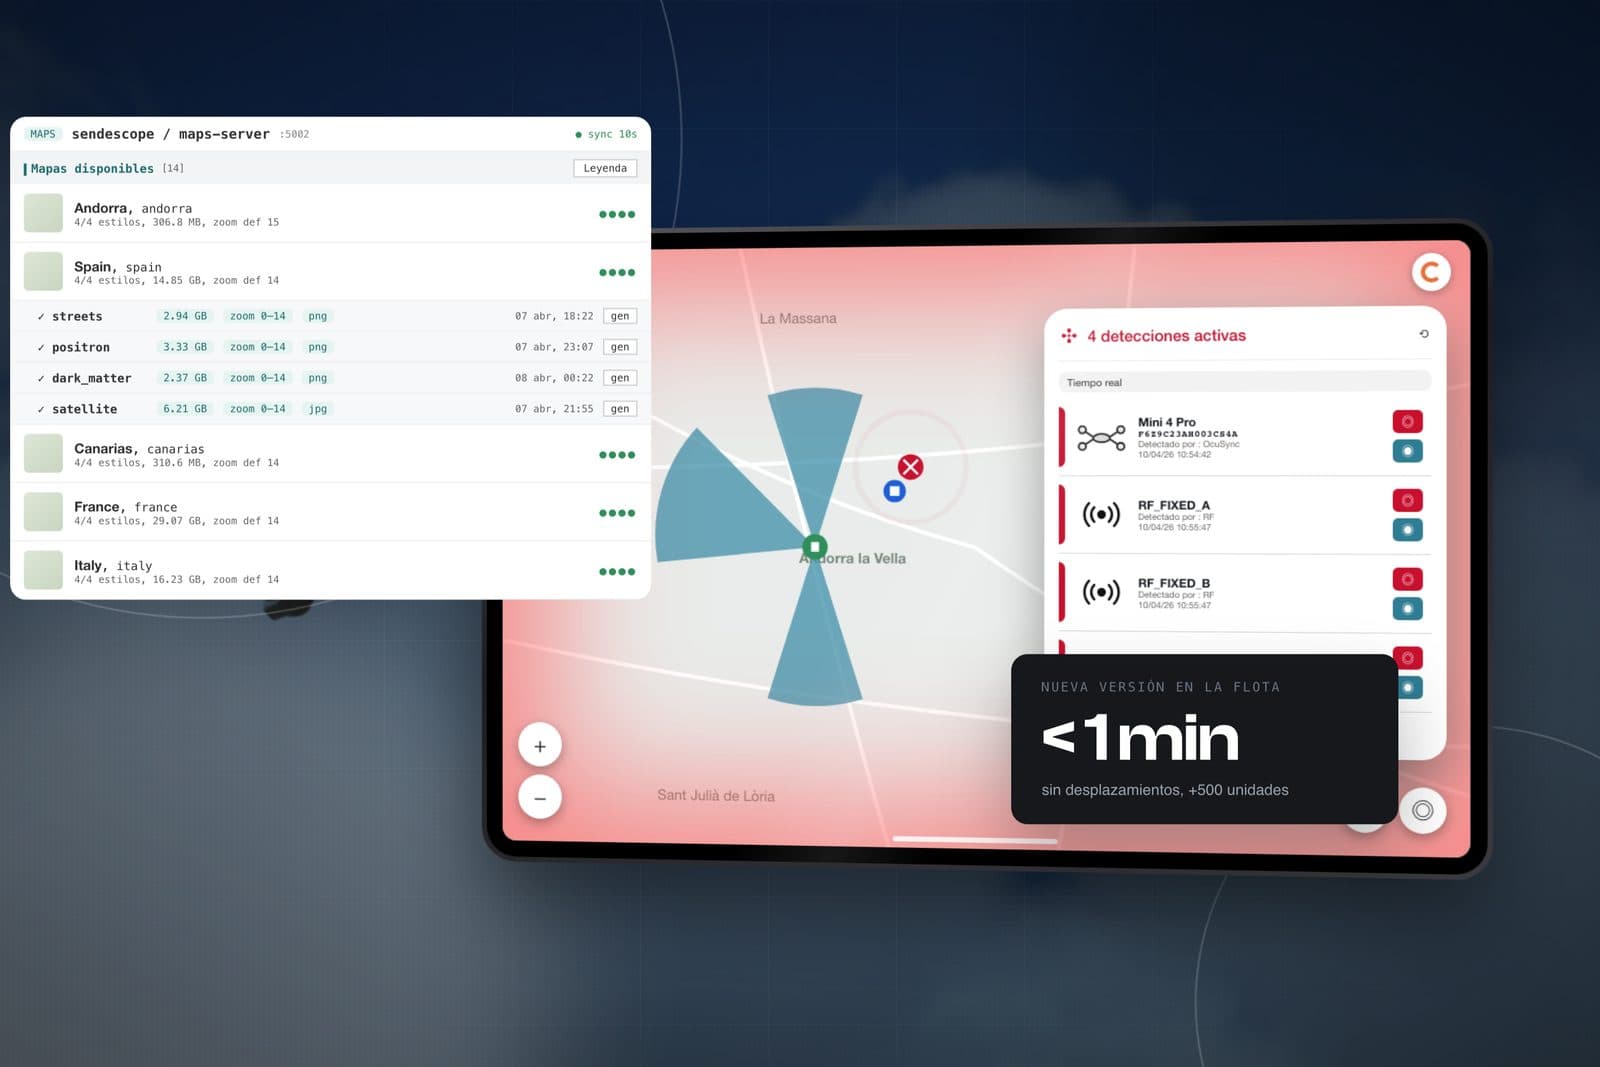
ASDT Corporation
A drone detection system with its own maps and remote updates for a fleet of more than 500 units.
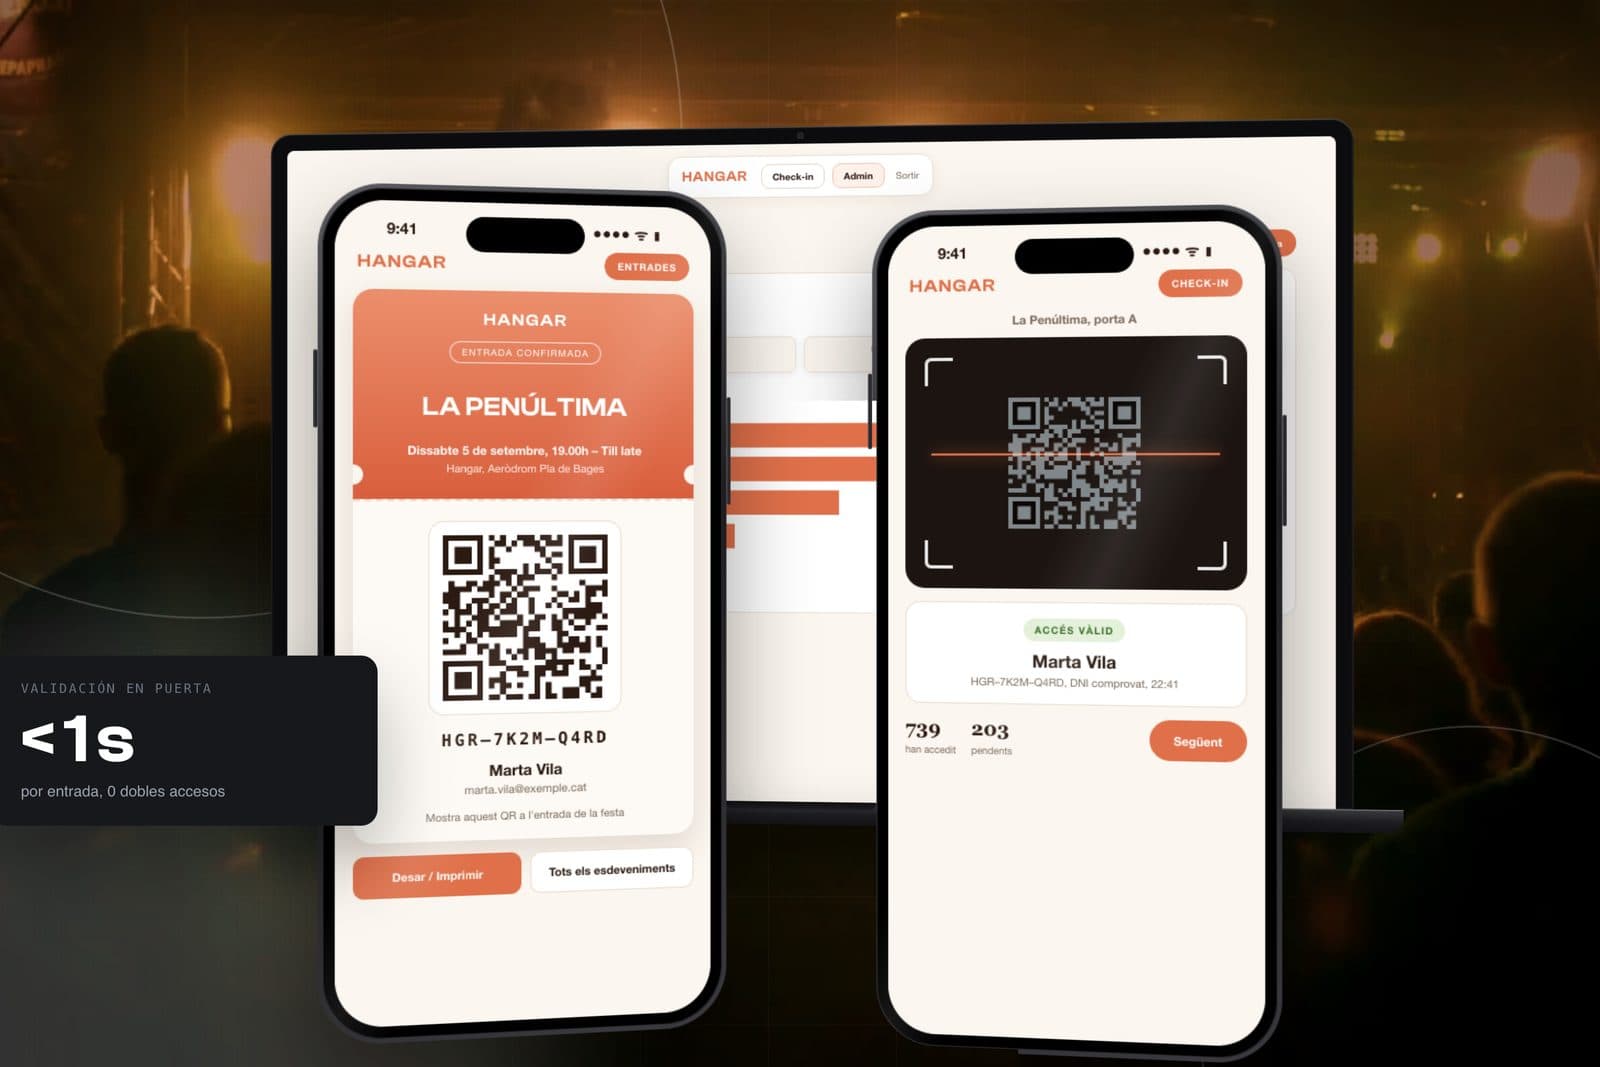
HANGAR
A ticketing and QR access-control platform of its own that validates every ticket in under a second and does away with third-party platforms.